
A user files a ticket. "The assistant said my expense was rejected because of the travel policy. That's not our policy." No stack trace. You ask the same question and get the right answer. Behind that one wrong sentence sit several model calls and a couple of tool calls, and you kept none of them.
I work on AI agents in production, and this is the part that surprises people. A normal bug lives in your code, so you read the code and the logs and work backwards. With an LLM feature, the logic that failed lives in a prompt, a retrieved document, and the model's reply to them. That reply happened once, and if you didn't record it, there is nothing to debug.
So observability for an LLM feature is something you decide before launch. Four decisions, and here's what I'd pick for each.
Share this post & I’ll send you some rewards for the referrals.
Your agent can only fix what it can see (Partner)

Sentry gives every coding agent something worth reading: traces, breadcrumbs, logs, and session replays. Seer turns that context into a verified root cause, with the file and line, checked against your actual code.
From there, let Seer open the pull request, or hand the analysis to Cursor, Claude Code, or Copilot through the Sentry MCP server. Your data is never used to train models.
(Thanks to Sentry for partnering on this post.)
1. Trace every step of every request
One user question is rarely one model call. An agent classifies the intent, routes to a sub-agent, retrieves the policy docs, calls a tool, and writes the answer. Record all of it as one tree per request, with the exact prompt and raw response of every model call and the arguments and result of every tool call.
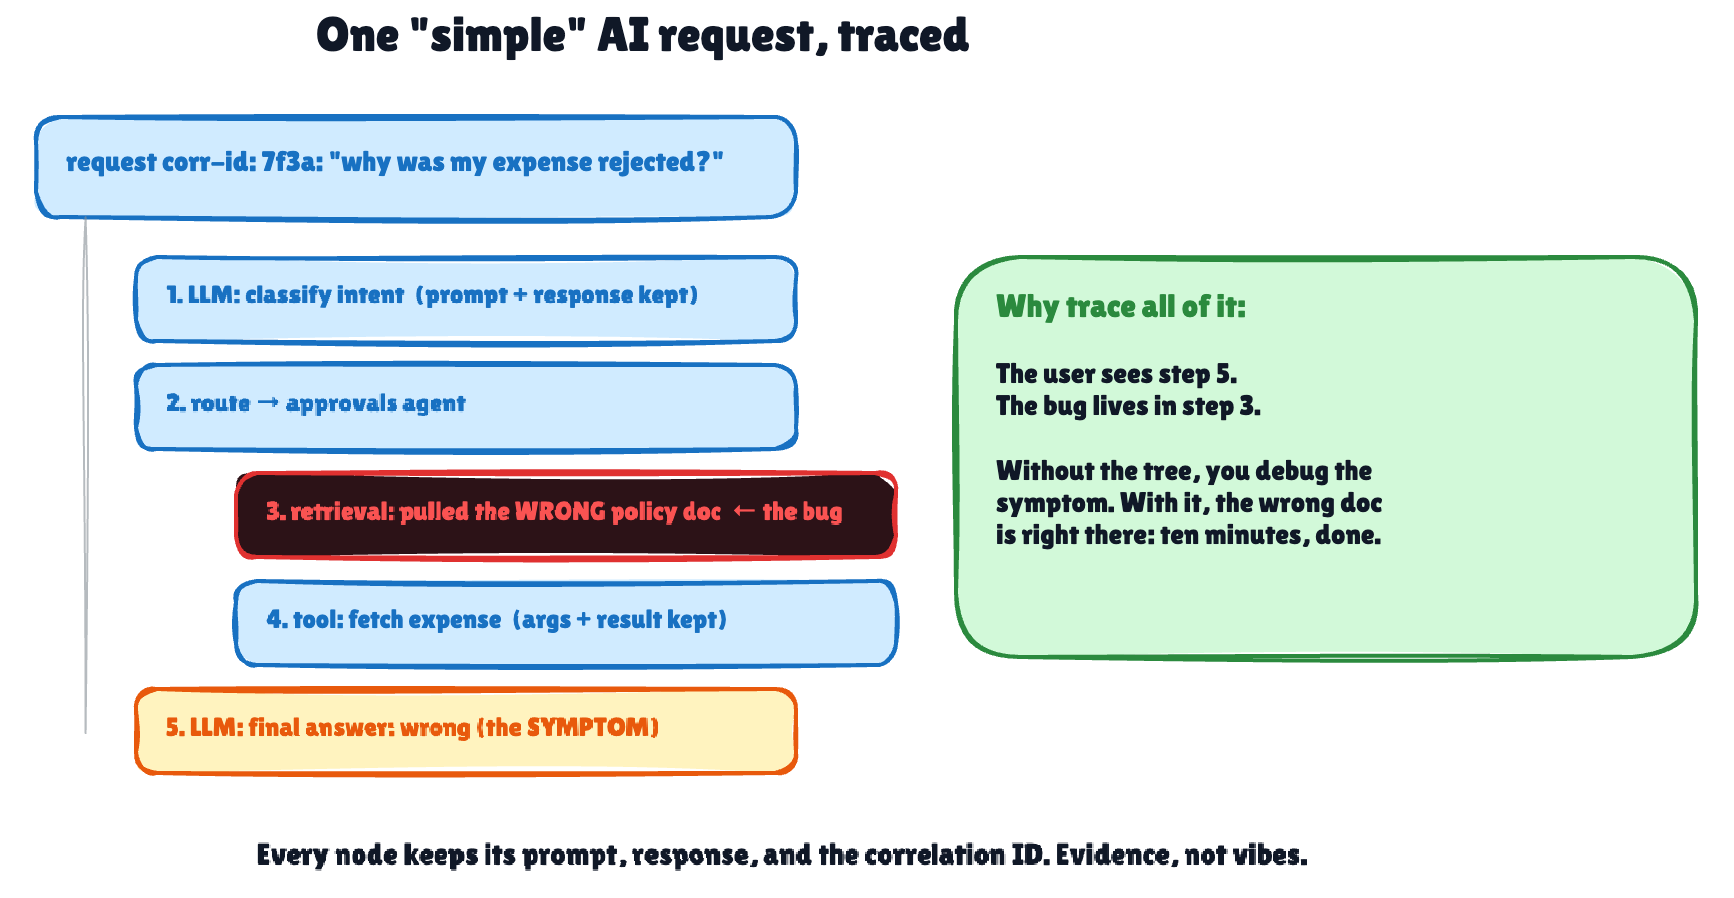
The tree finds the cause, not just the symptom. For the expense ticket, the wrong answer shows up at step 5, but the trace shows retrieval pulling an old travel policy at step 3. Without the tree you stare at step 5 for a day. With it you're done in ten minutes.
Tag every trace with the model ID, the prompt version, and the correlation ID from decision 2. You'll need those tags the moment a number moves in decision 3.
Any LLM tracing tool records this tree, and so does OpenTelemetry. Decide three settings now, because they hurt to change later.
Content capture. OpenTelemetry's GenAI conventions (still in development) make prompt and response content opt-in. The default trace has token counts and timings but no conversation.
Sampling. Trace 100% at launch. At high volume, keep every error and sample the successes. That takes tail sampling, which decides once the request is done. Head sampling decides at the start, before anything has failed.
Privacy. Prompts carry user data. Decide redaction, access, and retention before compliance decides for you.
2. Give every request one ID, and put the trace link in every log line
When support says "user X got a weird answer around 3 PM Tuesday," the correlation ID turns that into one search. It also lets you follow the request into systems the tracer can't see.
Mint the ID at the edge and carry it everywhere. If the caller sends one, check its format before you trust it. Then put it in every log line, service call, queue message header, and trace. Python middleware can set a contextvars.ContextVar once, and async code reads it anywhere without passing it through forty functions. Watch out for loop.run_in_executor, which runs your function without that context, so the ID quietly disappears. asyncio.to_thread copies it. (Node's AsyncLocalStorage does the same job.)
Put the trace link in the logger's context, too. On the agent system I've worked on, the logger middleware builds a link to the conversation's trace session from the thread ID in the request, before any model call runs. Every log line carries that link. On-call goes from any error to the full transcript in one click. If I could keep only one piece of this setup, I'd keep that click.
3. Watch five numbers, split by model and prompt version
Traces tell you what happened in one request. Metrics tell you whether something changed. LLM features drift after a prompt tweak, a model upgrade, or a shift in what users ask, and none of that throws an exception. These five numbers catch it.
Cost per request, in money. Uncached input, cache writes, cache reads, and output each have their own price, so "total tokens × one price" is wrong once caching is on. The newest models also think by default, billed as output even when hidden. Compute cost from the usage the API reports, summed over every call in the request.
Latency, p95, per step. The end-to-end number tells you users are hurting. The per-step numbers tell you where. For streaming, track time to first token too, because that's the wait users actually feel.
Error rate, quiet failures included. Count retries that ran out, tool failures the agent worked around, and fallbacks taken, on top of the 500s. Count stop reasons too, because a refusal and a reply cut off at
max_tokensboth come back as HTTP 200. If the fallback fires 30% of the time, your feature is 30% worse than you think.Schema-valid rate. The share of outputs that pass your validation on the first try, and the most sensitive alarm for prompt and model changes. With the provider's structured-output mode the JSON almost always parses, so count your business-rule checks instead.
Cache-read rate. The share of input tokens served from the prompt cache. One edit to the cached prefix can multiply input cost overnight with no change in behavior, and nothing else here tells you why.
Check how your provider counts input before you compute the cache rate. Anthropic's input_tokens covers only the uncached part. OpenAI counts cached tokens inside its input total, and OpenTelemetry follows that convention. With Anthropic's fields:
u = response.usage
total_input = u.input_tokens + u.cache_creation_input_tokens + u.cache_read_input_tokens
cache_read_rate = u.cache_read_input_tokens / total_input
Divide by input_tokens alone and a well-cached agent reports rates above 100%.
Baseline all five for a week, then alert on changes rather than fixed thresholds. Split every chart by the model and prompt-version tags from decision 1. That turns "validity dropped" into "validity dropped on prompt v14".
4. Log the system's verdicts, not "call completed"
Traces hold the transcripts and metrics hold the trends. Logs hold your system's judgments about the model, and they're what you'll search during an incident.
Log every decision your code makes about the model as a structured event. Validation failed, retry fired, fallback taken, guardrail triggered, sent to human review, each with the specifics as fields. A user's thumbs-down is a verdict too. Every event carries the correlation ID and the trace link:
{"event": "llm.validation_failed", "severity": "warning",
 "correlation_id": "7f3a", "prompt_version": "expense-policy-v14",
 "field": "policy_status", "rule": "enum", "got": "partially_compliant",
 "trace_url": "https://traces.example.com/t/7f3a"}
Skip "LLM call completed successfully" at info level, ten thousand times an hour. It carries no decision and buries the one line that mattered. That detail belongs in the trace.
Put the four together and debugging gets boring. The schema-valid alert fires on prompt v14. You filter logs to llm.validation_failed, see the same new enum value in every failure, and click three trace links. Tuesday's prompt change added "partially compliant" as an option. No guessing.
You're debugging conversations now
The logic that fails in an LLM feature is a prompt and a reply that existed once. Either you kept the transcript or you'll never know what happened. The setup takes a day or two before launch, or you build it anyway, during the incident.
📌 TL;DR
LLM bugs have no stack trace. The failing logic is a prompt and a reply that happened once, so record them from day one.
Trace every step as one tree per request, with exact prompts and responses, tagged with model and prompt version. OpenTelemetry makes content capture opt-in, and "keep every error" needs tail sampling.
One ID end to end, through logs, services, queues, and traces, plus the trace link in every log line.
Five numbers: cost per request, p95 latency per step, error rate with refusals and fallbacks, schema-valid rate, and cache-read rate. Alert on changes, split by model and prompt version.
Check the token math: price each token type separately, and know that Anthropic's
input_tokensexcludes cached tokens while OpenAI and OpenTelemetry include them.Log verdicts, not "call completed": validation failures, retries, fallbacks, guardrails, and thumbs-downs, each with the ID and trace link.
Related: 7 Things That Break LLM Apps in Production covers the failures these numbers catch, and The 3 Layers of Testing AI Agents shows how this dashboard becomes your production test report.

Follow me on LinkedIn | Twitter(X) | Threads
Thank you for supporting this newsletter.
Consider sharing this post with your friends and get rewards.
You are the best! 🙏

Press the Like button if you found this post helpful